Everywhere you look in the running world, it seems that course records are falling.
In February 2025, the track and field world was taken by storm as the indoor mile world record fell twice in five days, and the indoor 3,000-meter and 5,000-meter world records were also reset. This increase in speed at the top of the field has also been seen in the trail running world, and course records across the ultra-distance spectrum are being broken left and right. In the past year, some of the most prolific races saw their course records fall: the Hardrock 100, Leadville 100 Mile, JFK 50 Mile, and Black Canyon 100k. Need I go on?
But what is driving trail racing to become faster at the front of the pack? Is this increase in speed also reflected in mid-pack runners? Is this truly a leap into a new frontier, or have I just been consuming too much iRunFar media?
In this article, I turn to the data to explore how course times have progressed over the years at both the front and the middle of the field. I focus on a dataset comprising “competitive” ultramarathons. My intention is to look at how some of the most popular races have evolved in competitive nature over the years to:
- Explore the shift in performance over time, and
- Examine factors that might be contributing to performance increases.
Historical data is pulled from DUV Ultra Marathon Statistics.
In this article, I look at data involving absolute finish times. I want to acknowledge that the running conditions year-to-year are not always equal and that variables such as temperature, precipitation, course changes, and course conditions do impact times. I hope to look at a large enough dataset to visualize key trends over time.
In the second half of this article, we examine some of the possible reasons why trail runners are getting faster.

The start of the 2025 Black Canyon 100k, a race where both the women’s and men’s course records fell. Photo: World Trail Majors
Shifts in Performance at the Top of the Field
Let’s start with top performances. I was glued to the screen for this year’s Black Canyon 100k, watching the dominant performances of Riley Brady and Seth Ruhling. With a competitive field lining up at the start line and three Western States 100 Golden Tickets on the line in both the women’s and men’s races, it was set to be a fast race from the beginning. At the finish, both course records toppled, with Brady going nearly 30 minutes under the previous women’s course record, and Ruhling breaking the men’s by five minutes. [Editor’s Note: Riley Brady identifies as non-binary but competes in the women’s division.]
What has the progression of these top times at the Black Canyon 100k looked like over the years? To get a better view of how performance has shifted over time, I plotted the top 25 results by year and gender since 2014.
Black Canyon 100k Top 25 Men’s Performances by Year
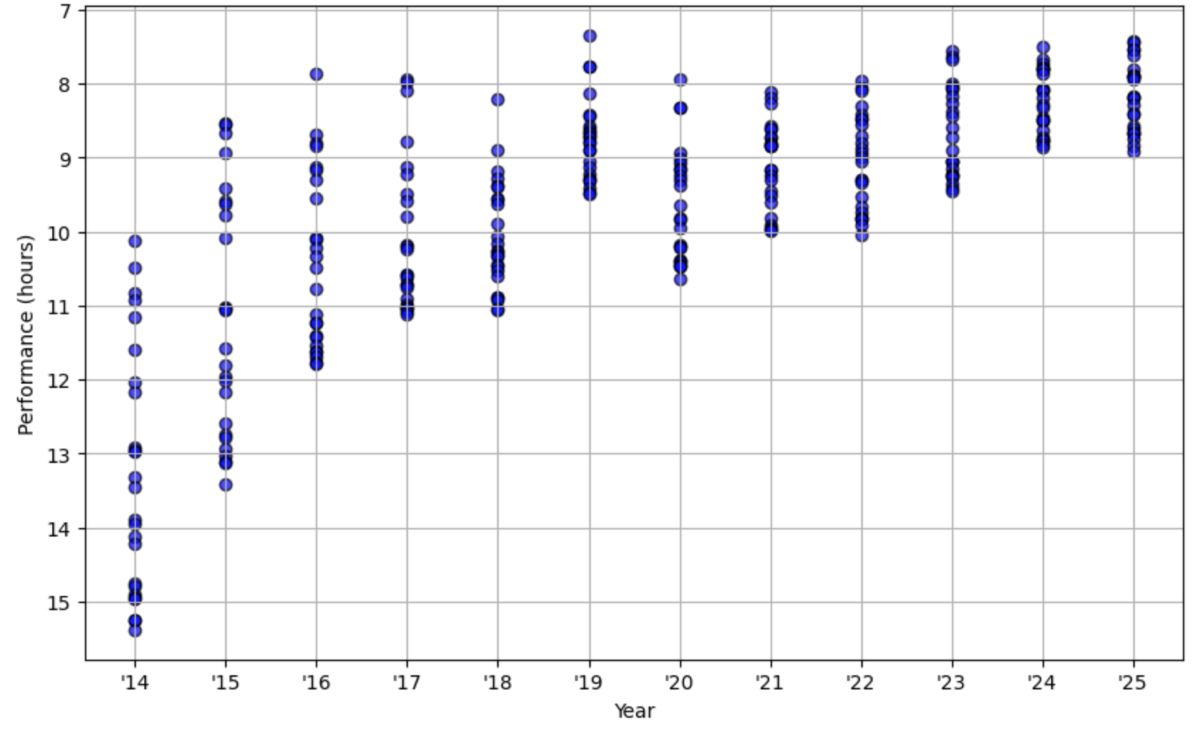
Chart showing the finishing times of the top 25 men at the Black Canyon 100k each year.
Black Canyon 100k Top 25 Women’s Performances by Year
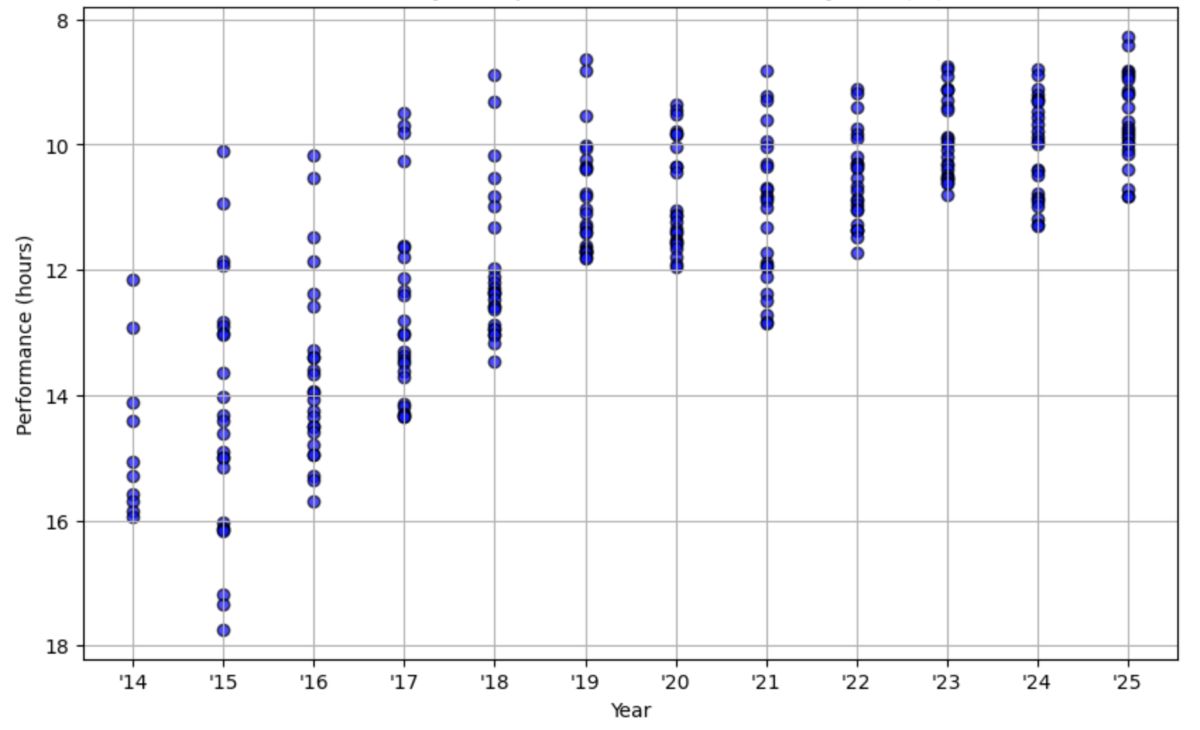
Chart showing the finishing times of the top 25 women at the Black Canyon 100k each year.
In these graphs, we can see the winning times steadily increasing over the years, but even more interesting is visualizing the condensing of the field as the races become more competitive. For the men’s field in 2014, there was over a five-hour gap between first and 25th place, while in 2025 that gap was less than two hours. A similar change can be seen over the years in the women’s field.
Looking at other races we observe a similar trend:
Javelina 100 Mile Top 25 Men’s Performances by Year
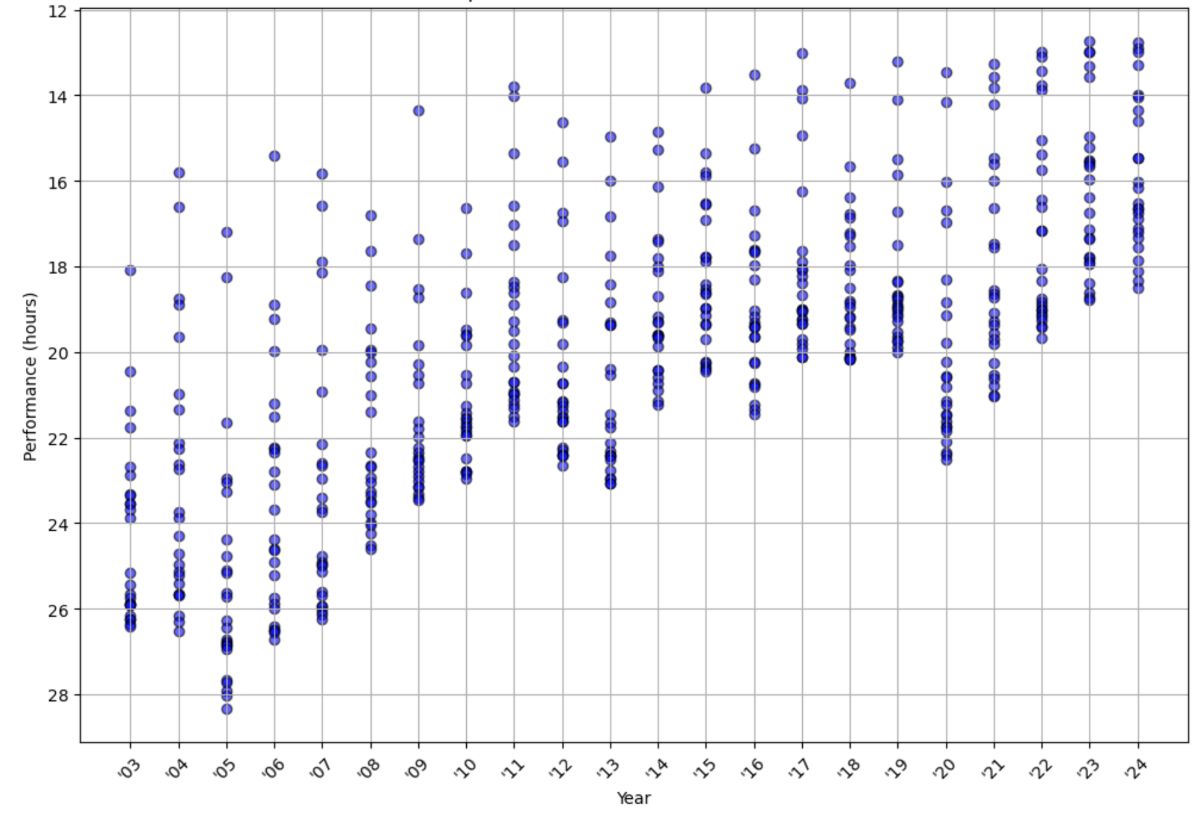
Chart showing the finishing times of the top 25 men at the Javelina 100 Mile each year.
Javelina 100 Mile Top 25 Women’s Performances by Year
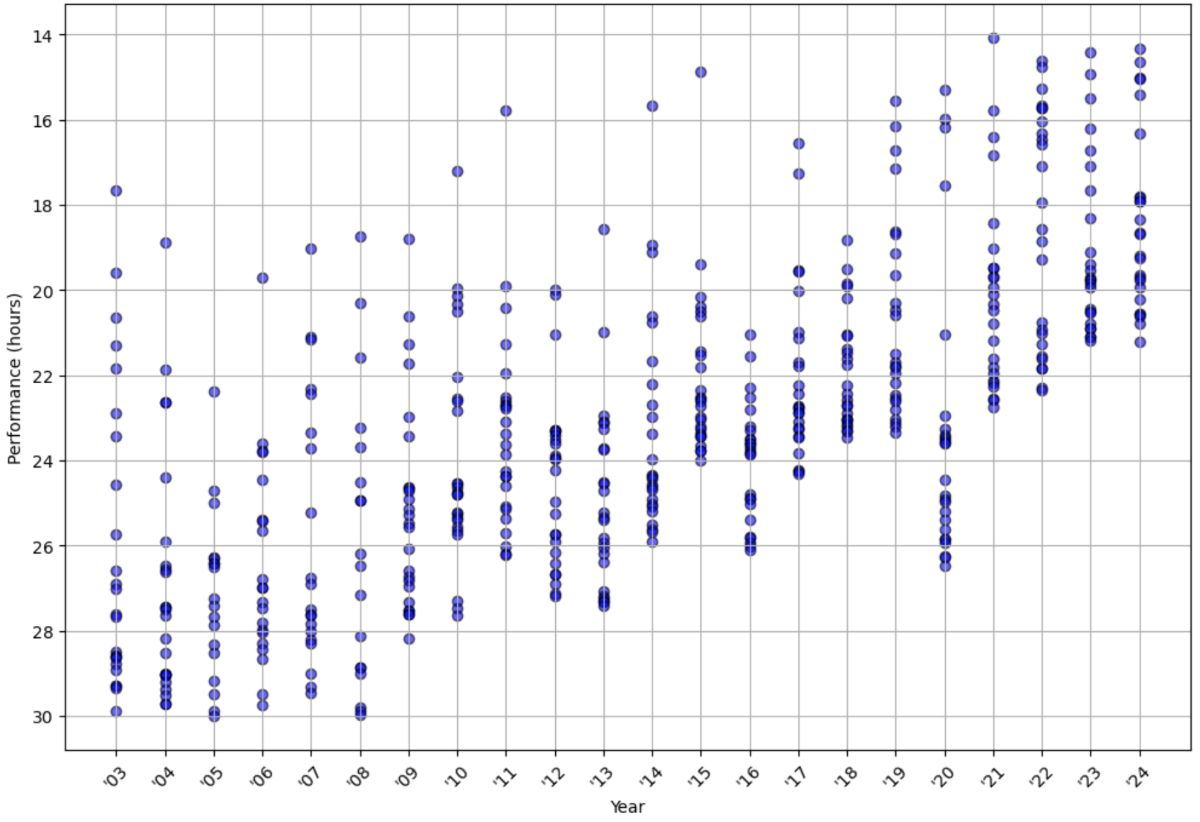
Chart showing the finishing times of the top 25 women at the Javelina 100 Mile each year.
CCC Top 25 Men’s Performances by Year
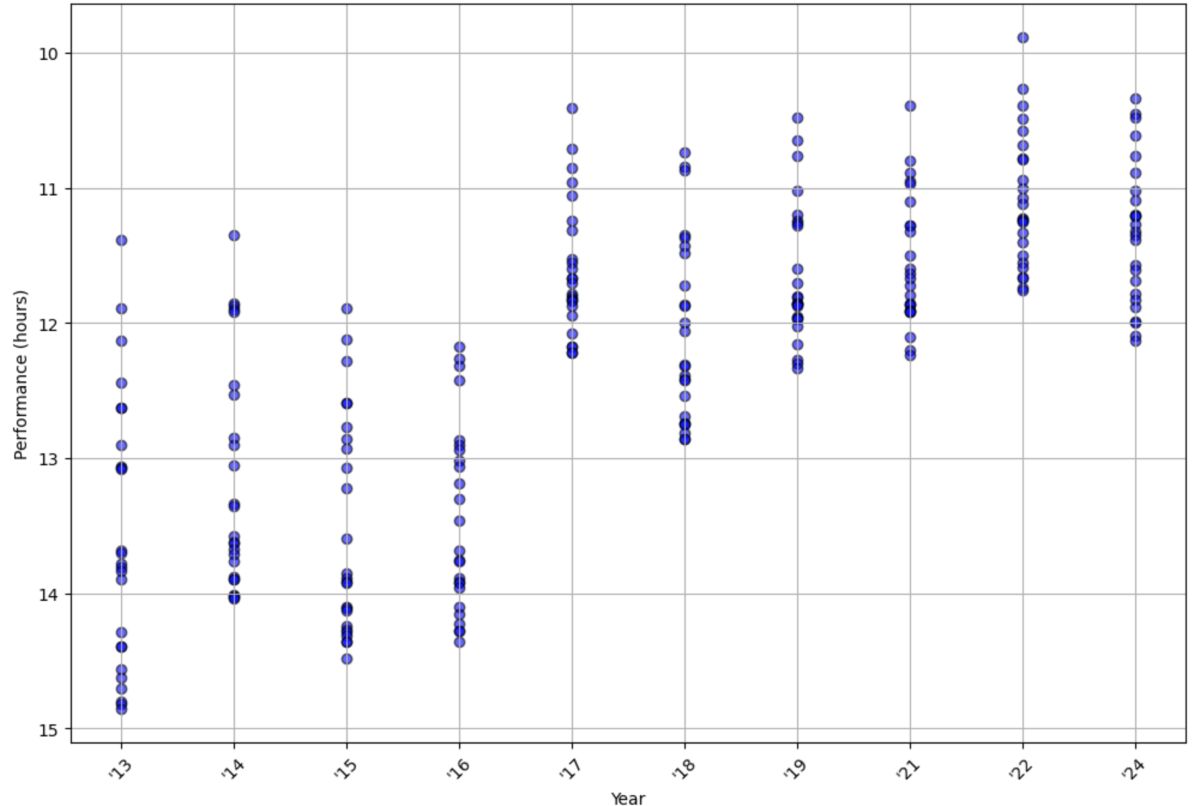
Chart showing the finishing times of the top 25 men at CCC each year.
CCC Top 25 Women’s Performances by Year
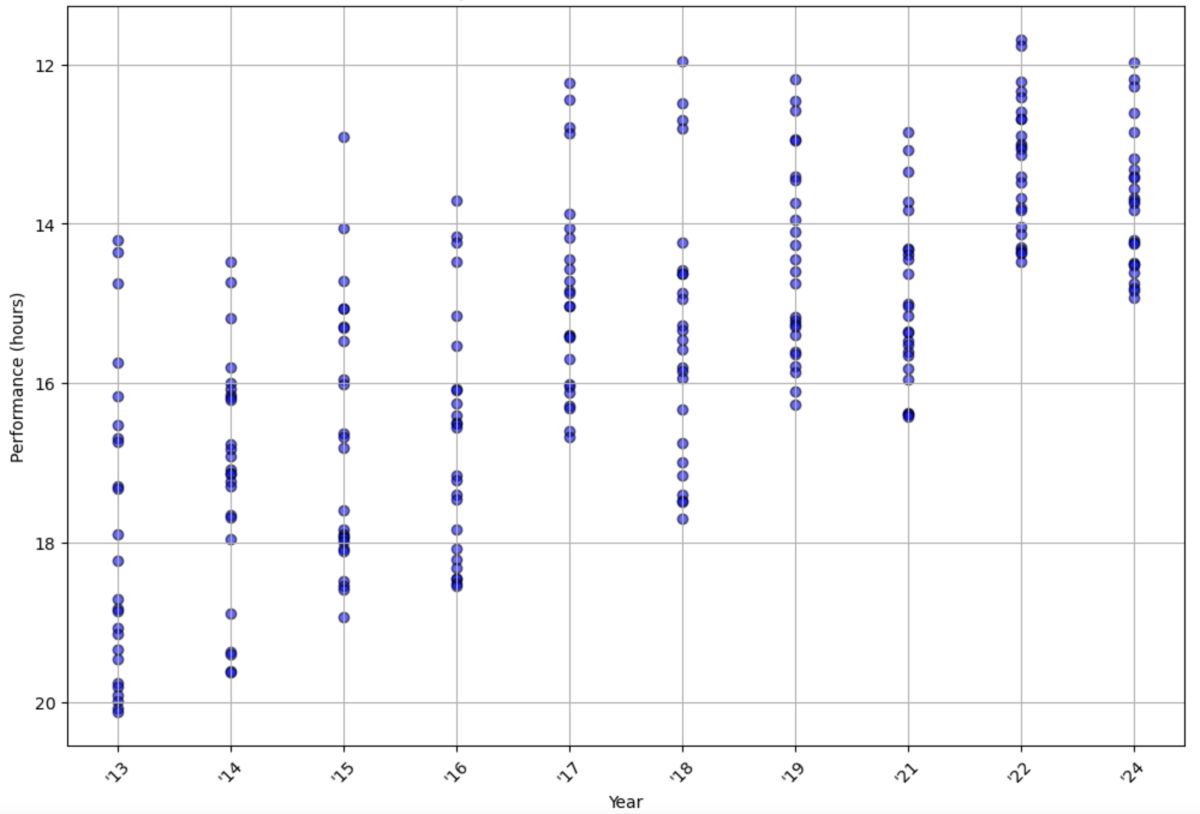
Chart showing the finishing times of the top 25 women at CCC each year.
Shifts in Performance in the Middle of the Pack
Is it just the top of the field that is getting faster, or is it everyone? We can see from the graphs above that the top times are getting pushed faster and the front of the field condensed, but is it just because a few more folks are gunning for glory at the most high-profile races?
In this next section, we look at the entire field of these races, to explore what the overall middle-of-the-pack progression has looked like. In the following graphs, we plot the median (middle of the pack) finish times over the years, along with a fit trend line.
Javelina 100 Mile Median Performances by Year
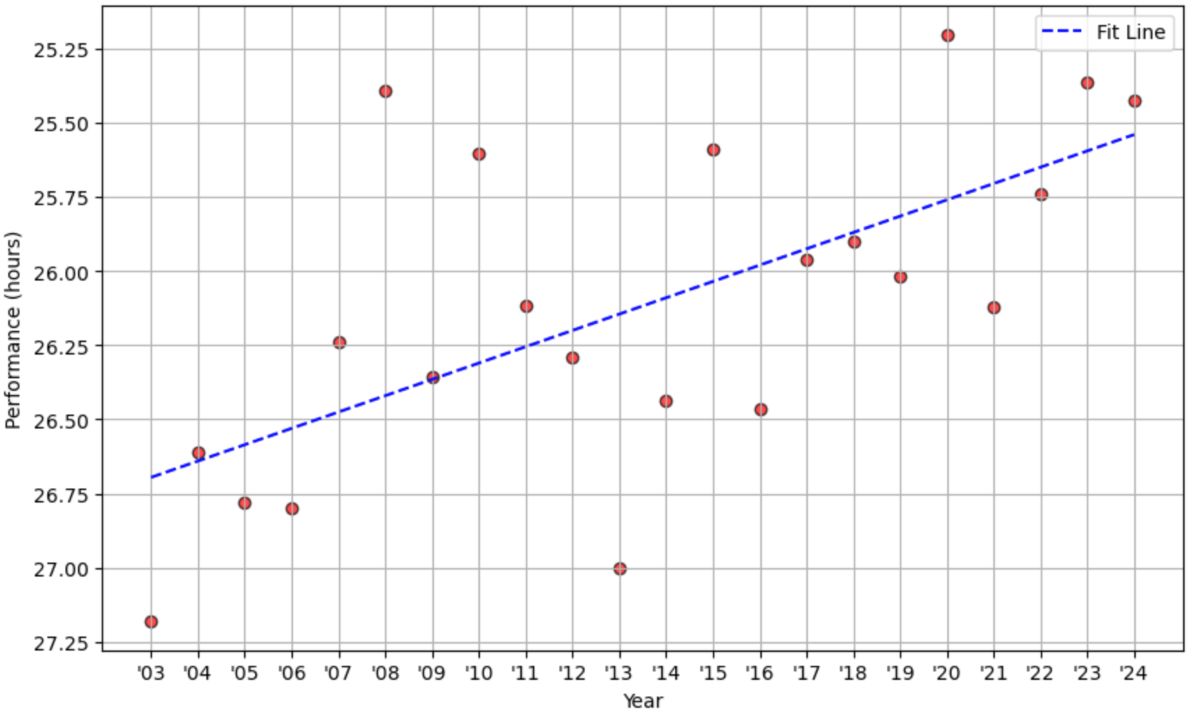
Chart with trend line showing the median finishing time at Javelina 100 Mile each year.
Black Canyon 100k Median Performances by Year
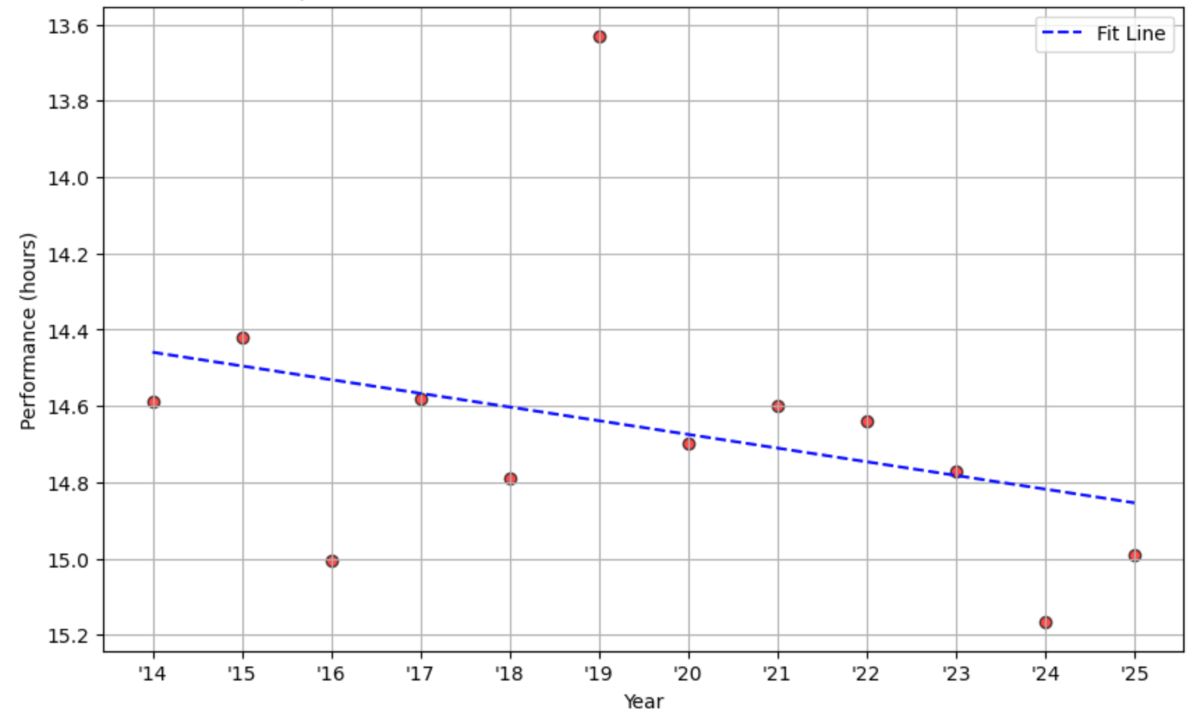
Chart with trend line showing the median finishing time at Black Canyon 100k each year.
CCC Median Performances by Year
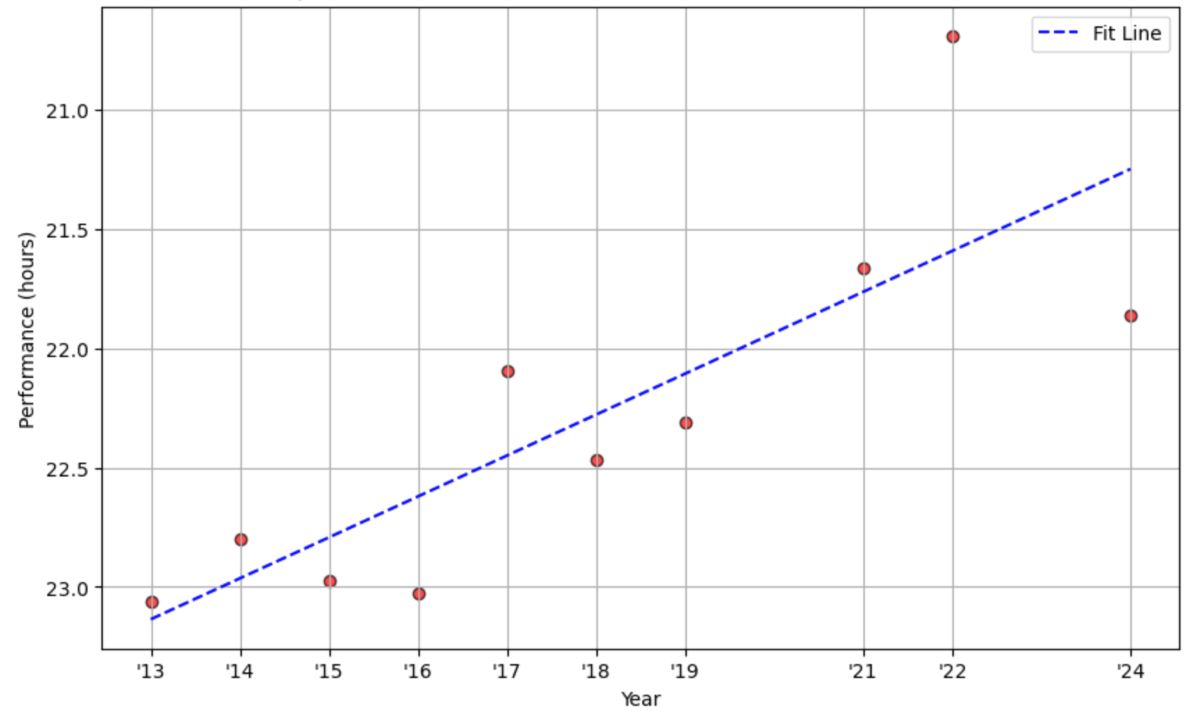
Chart with trend line showing the median finishing time at CCC each year.
These graphs show a much more muddied picture. Some races appear to have middle-of-the-pack performances that are steadily increasing, while one is declining. These graphs are likely more variable as they are dependent on the entire field, which has grown to encompass people who all have different goals for competing.
I really like the following graph of Javelina 100 Mile finish times, that shows the distribution of runners finishing in certain time buckets. On the left we see the elite runners gunning for podium spots, a spike around 24 hours for folks trying to go sub-24 hours, and another spike right before the cutoff for those just trying to finish.

Chart showing the distribution of finishing times at the Javelina 100 Mile.
People have a variety of different goals at ultramarathons, and that is likely leading to the flatter median finish times across the entire field. It is interesting to note the one race that requires qualification, CCC, has seen a pretty steady trend in faster finish times. This might suggest that the middle of the pack for more seasoned racers is, in fact, progressing.

Jennifer St. Amand, the final official finisher of the 2023 Western States 100, who beat the cutoff by 21 seconds. Back from the front of the pack, a range of runners are chasing their own goals with different motivations. Photo: iRunFar/Sarah Brady
Possible Factors Leading to Shifts in Performance
In this next section, we explore some of the factors that may be contributing to an improvement in race times for the top of the field. We focus on the top performances as these have the clearest upward trend over time. Many of the factors discussed may be applicable to a wider range of runners, depending on whether they are riding the wave of performance-enhancing factors.
If you’re looking for a clean-cut answer, this section is not for you. There are a variety of factors that may contribute to records being broken, and much of this is totally speculative at this point, and it is additionally difficult to parse out the individual impact of each one. We discuss a few at a high level and then dig into a few others that have some data surrounding them.
1. Better Technology
Carbon-plated shoes are starting to become a more common sight at trail running events, with small efficiency increases having been found among runners in some trail running terrain in some studies. More accurate heart rate monitors allow runners to track their effort levels and maintain a constant output over the course of long events.

The carbon-plated Nike Ultrafly is one of many shoes on the market to offer the stability and speed to go fast on trails. Photo: iRunFar/Eszter Horanyi
2. Fueling
While this is highly speculative at this point, it’s possible that the recently popularized high-carbohydrate fueling technique is allowing some athletes to maintain blood glucose levels for longer durations, leading to better recovery during training and sustained efforts over longer-distance races.
3. Training Theory
As more data becomes available around optimized training approaches, elite athletes may be able to push to new levels through optimizing speed and endurance.
4. Increased Competition
The field of runners lining up for top races is becoming increasingly competitive. With Golden Tickets to the Western States 100 and professional contracts on the line, more and more top athletes are racing the most prolific events. By looking at UTMB Index scores among top finishers, we can see how this competitive landscape has shifted over the years.
Below is a chart of UTMB Index scores from the Black Canyon 100k men’s field in 2022 versus 2025. Rankings are taken from the end of the prior season, so their performance in the event does not bias the rankings.

Performance indices of top men’s finishers of the 2022 Black Canyon 100k.
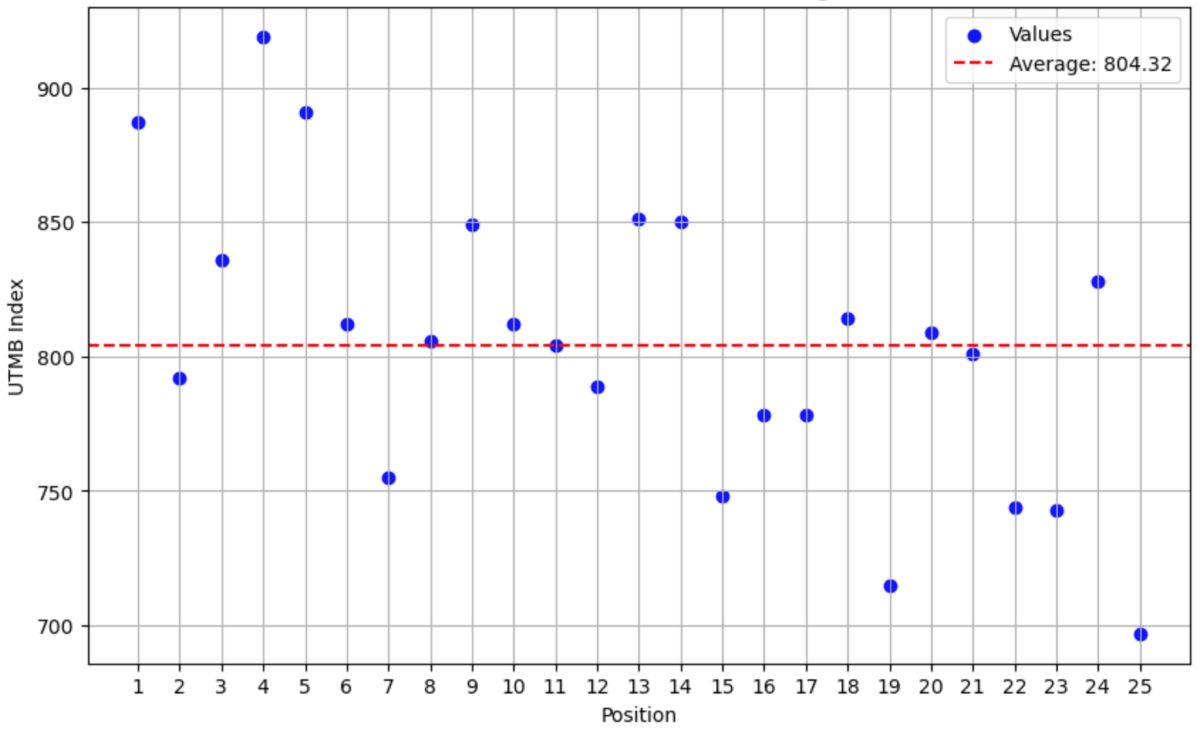
Performance indices of top men’s finishers of the 2025 Black Canyon 100k.
In the men’s field, the top 25 finishers in 2022 had an average index of 782, while in 2025 the average index was over 20 points higher at 804.
Looking at the women’s field, we see an even greater shift. In 2022, the average UTMB Index of the top women finishers was 662, versus an average index of 689 in 2025, a 27-point difference.

Performance indices of top women’s finishers of the 2022 Black Canyon 100k.
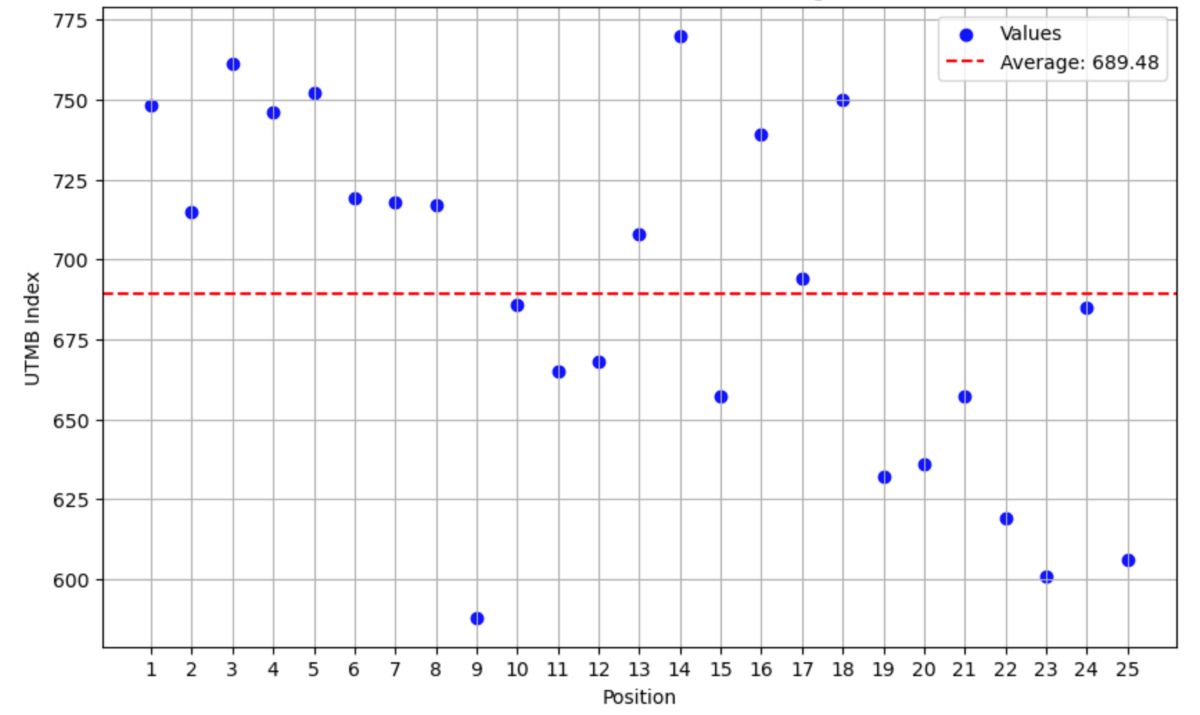
Performance indices of top women’s finishers of the 2025 Black Canyon 100k.
I recognize that one’s UTMB Index does not define a runner nor is the UTMB Index a surefire way to rank athletes and their performances, but it is a generally helpful indication to understand the level of runners entering a race and the makeup of the top of the field. These increasingly competitive fields demand that runners push from the start and take some risks in pursuit of the podium.
Conclusion
The top of the field has been pushed upward over the last several years, and we will likely see this trend continue as a result of a variety of factors. New technology, knowledge, and competition in the ultrarunning world may have all contributed to this performance increase at the top of the field, and these factors can be beneficial for all athletes who make the most of the changing landscape. Wherever you are in your trail running journey, there is something to be learned from the factors leading to speed improvements in the sport.
We hope this article gave you some insight into how the course records at top ultra events are being pushed upward, and a view of how performances across the field have shifted over time. There are a variety of factors leading to performance increases, impacting different runners in different ways.
Whatever the case, it’s clear that the sport is getting faster. Hop aboard the ship.

Hayden Hawks (U.S.) lets out a yell in celebration on his way to win the 2024 CCC.
Call for Comments
- What other factors do you think are leading to this shift in performance?
- What changes have you observed in how people approach ultramarathons?
- Are your race times improving? Why/why not?
